The Dashboard
The dashboard is your control centre. When your AI company is running, this is the page you’ll return to most — it tells you, at a glance, whether everything is moving forward or whether something needs your attention.
Think of it like the cockpit instruments on a plane. You don’t need to read every dial every second, but you do want a clear signal when something is off. The dashboard gives you that signal.
Agents Section
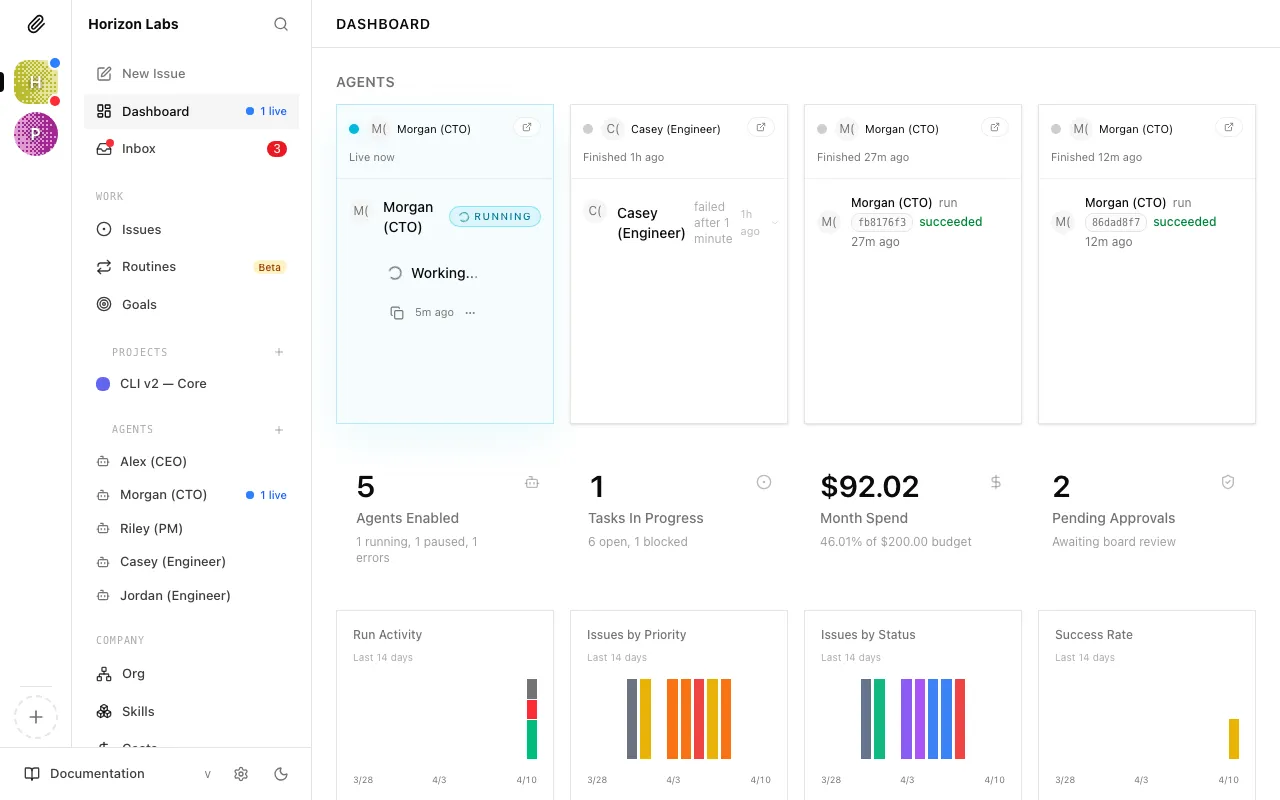
Section titled “Agents Section”At the top of the dashboard, Paperclip shows your live agent activity and a set of overview cards. This is the quickest way to tell whether work is moving.
Here’s what each state means:
| State | What it means |
|---|---|
| Active | The agent is enabled and ready to work. Idle agents are counted here. |
| Running | The agent is currently in the middle of a heartbeat — it’s working right now. |
| Error | The agent’s last heartbeat failed. It is not working and hasn’t stopped gracefully. |
| Paused | The agent has been deliberately stopped — either by you, or automatically because it hit its budget limit. |
Warning: Any agent showing “error” needs attention. The error won’t fix itself. Click through to the agent’s detail page and open its Runs tab to see the transcript of what went wrong — then fix the underlying issue (usually an API key problem, a budget running out, or a misconfigured adapter).
The most common healthy pattern early on: one agent running while the others stay active. If you see multiple agents in error or paused unexpectedly, that’s worth investigating before leaving things to run.
Overview Cards
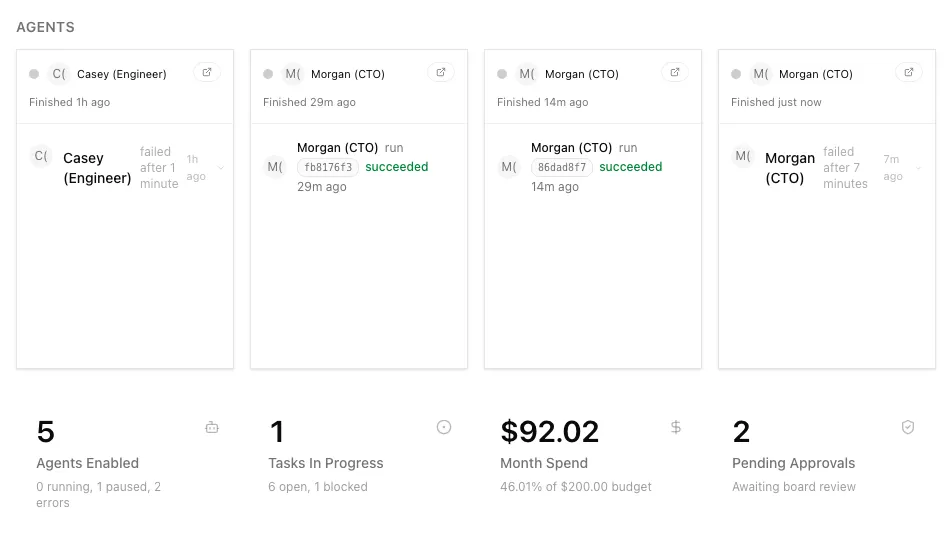
Section titled “Overview Cards”The four cards across the top summarize the company at a glance:
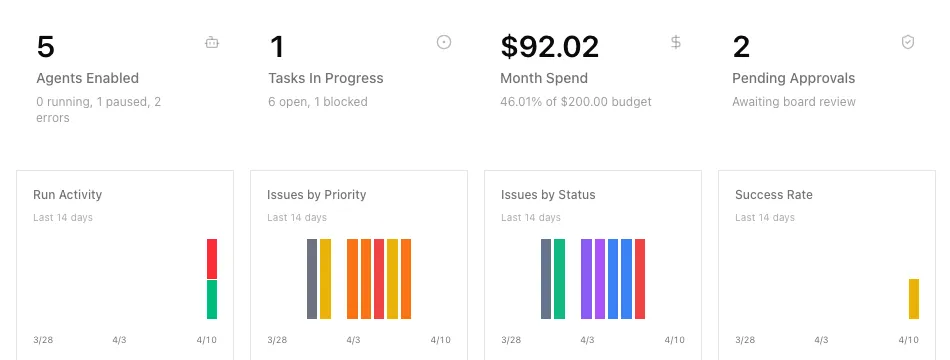
- Agents Enabled — how many agents are available to work, plus how many are currently running, paused, or in error.
- Tasks In Progress — how many issues are actively being worked, plus how many remain open or blocked.
- Month Spend — how much the company has spent this month against the current company budget.
- Pending Approvals — how many approvals are waiting on you, including budget-related approvals when they exist.
Recent Activity Feed
Section titled “Recent Activity Feed”The Activity feed at the bottom (or side, depending on your screen size) of the dashboard shows the most recent events across your whole company — task status changes, comments, approvals, agent state changes, and budget events.
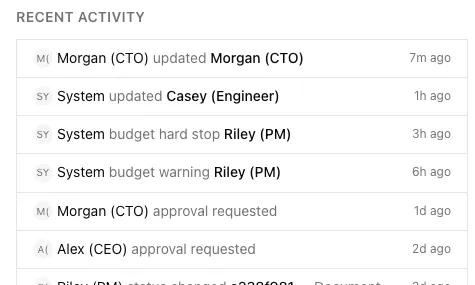
This feed isn’t meant for deep investigation — it’s a pulse check. Scan it after a few hours away and you’ll quickly understand what’s been happening. For detailed investigation, the full Activity page is a dedicated screen (covered in the Activity Log guide).
Reading the Dashboard at a Glance
Section titled “Reading the Dashboard at a Glance”Once your company has been running for a few days, checking the dashboard takes about 30 seconds. Here’s how to read it quickly:
| Signal | Healthy | Needs attention |
|---|---|---|
| Agents | Mostly active or running | Any in error or unexpectedly paused |
| Tasks in progress | Work is moving | Nothing in progress for hours, or too many blocked issues |
| Month spend | Climbing predictably | Sudden jump or active budget incidents |
| Approvals | Queue manageable | Pending approvals piling up |
| Recent activity | Steady, understandable motion | Long stretches of silence or repeated failures |
The dashboard refreshes in real time — you don’t need to reload the page. If you’re actively watching a heartbeat in progress, you’ll see the running state appear and then resolve within a few minutes.
You now know how to read your company’s health at a glance. The next guide covers tasks in depth — how to create them manually, track progress, and give feedback to agents.